The "Statistics" window
The Statistics window presents statistical analysis for each model from the model equation window.
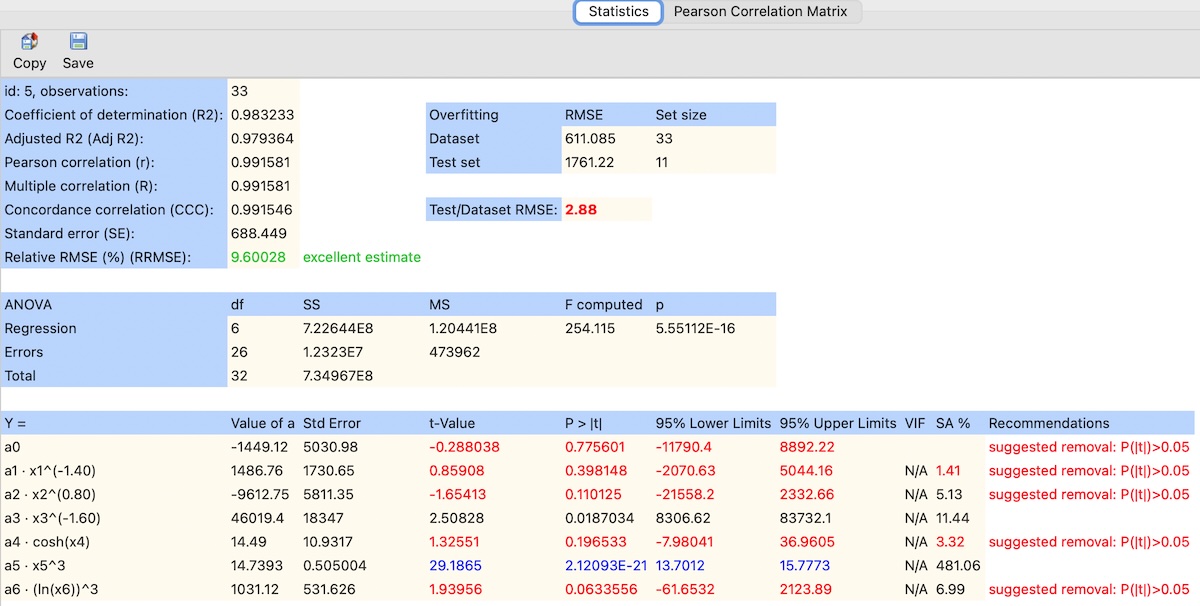
Statistical parameters presented in this window are calculated as follows:
- Coefficient of determination (R2):
R2 = 1 - SSR / SST - Adjusted R2 (Adj R2):
Adj R2 = 1 - [(1 - R2) · (n - 1) / (n - k - 1)] - Pearson correlation (r):
r = Σ[(y(i) - ȳ)(ye(i) - ȳe)] / √[Σ(y(i) - ȳ)2 · Σ(ye(i) - ȳe)2] - Multiple correlation (R):
R = √R2 - Concordance correlation (CCC):
CCC = (2 · r · sy · se) / (sy2 + se2 + (ȳ - ȳe)2)
CCC evaluates both precision (correlation) and accuracy (agreement between observed and estimated values). Values close to 1 indicate strong agreement. - Standard error (SE):
SE = √(SSR / (n - k - 1)) - RMSE (Dataset):
RMSEDataset = √(Σ(y(i) - ye(i))2 / n)
Computed using the entire dataset. It reflects the overall fit quality of the model. - RMSE (Test set):
RMSETest = √(Σ(y(j) - ye(j))2 / nTest)
Computed using the independent test subset. It is used to evaluate model generalization. - Test/Dataset RMSE:
Test/Dataset RMSE = RMSETest / RMSEDataset
Values close to 1 indicate good generalization. Higher values suggest potential overfitting. - Relative RMSE (%) (RRMSE):
RRMSE (%) = 100 · RMSEDataset / |ȳ|
- where:
- SSR is the Sum of Squares of Residuals,
- SST is the Total Sum of Squares,
- n is the number of observations in the dataset,
- nTest is the number of observations in the test set,
- k is the number of predictors,
- y(i) is the observed value of the dependent variable,
- ȳ is the mean of the observed dependent variable,
- ye(i) is the estimated value of the dependent variable,
- ȳe is the mean of the estimated dependent variable,
- sy and se are the standard deviations of observed and estimated values.
The "VIF" column in the regression analysis table presents the variance inflation factor (VIF):
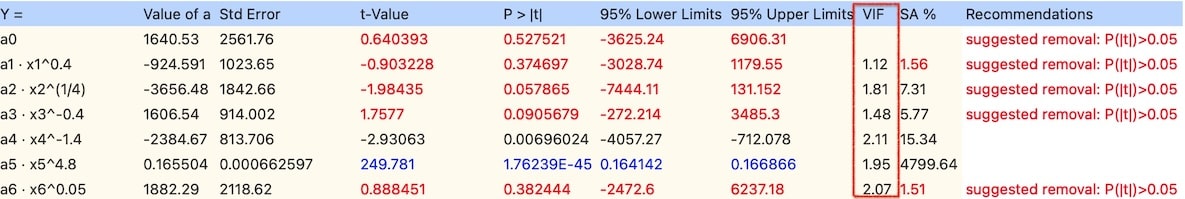
The formula for calculating VIF is as follows:
VIFi = 1 / (1 - R Squarei)
where:
- VIFi represents the Variance Inflation Factor for the i-th predictor variable.
- R Squarei is the coefficient of determination (R-square) when the i-th predictor variable is regressed on all other predictor variables.
The VIF (Variance Inflation Factor) is commonly used for detection of multicollinearity (more details can be found here). When the VIF value exceeds 5, it indicates a high degree of collinearity. In such cases, predictors with VIF values surpassing the threshold of 5 are marked in red.
The "SA %" column presents the results of the sensitivity analysis:
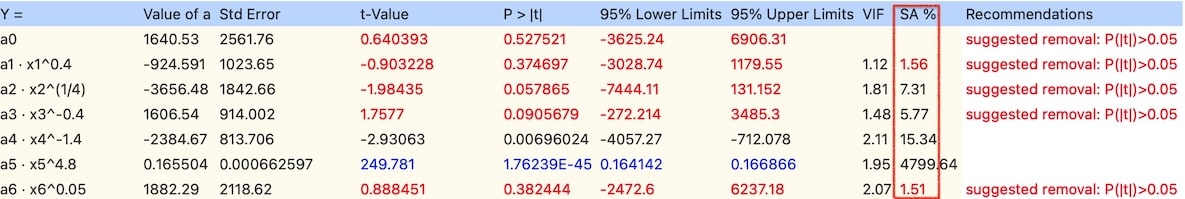
Sensitivity analysis is a technique used in data analysis and machine learning to assess the impact of individual input variables on forecast outcomes. It allows for the identification of input variables that are critical to prediction accuracy, as well as those that can be omitted without quality loss, especially when other significance measures, such as t-value, cannot be used. This situation occurs when the distribution of model residuals is not normal, making inference difficult.
The ndCurveMaster program determines the importance of a given variable based on the ratio of the estimation error (RMSE) for the model with the omitted variable (RMSEo) to the estimation error for the model with all input variables (RMSEf), as follows:
SA = (RMSEo/RMSEf - 1) * 100
where:
- RMSEo – the RMSE error with the omitted variable,
- RMSEf – the RMSE error with all variables.
A higher value of this coefficient indicates a greater impact of the given variable on the prediction outcome. The removed variable causing the largest increase in error achieves the highest RMSER value and can be considered the most significant. Based on SA values, a ranking of variables by importance can be developed, and non-significant variables can be eliminated.
Unacceptable values of statistics such as t-value, VIF or SA are displayed in red color. In such cases, the "Recommendation" column shows the message "suggested removal," which means that the predictor is insignificant.
The highest t-value values and the lowest p-values are displayed in blue color. This indicates that the predictor is the most significant among the others.
Unacceptable RRMSE values are marked in red while acceptable values are shown in green
Blocked predictors are displayed in italics.
If all equations in the model are significant, the "Auto Reduce" option is not available.