The Graphs window
The Graph window displays the following plots: Fit-line curve, Scatterplot, Residuals, Standardized Residuals, Histogram, and Q-Q Plot. To view any plot in a new full-screen window, click on the  button located in the top right corner of the Graphs window, as shown below:
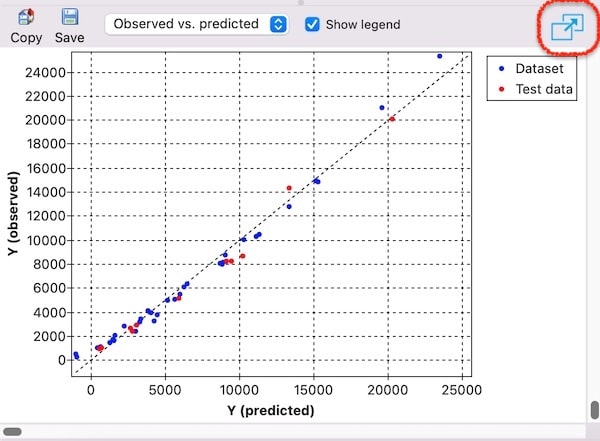
Use this button to enlarge the plot and view it in detail.
Fit-line curve:
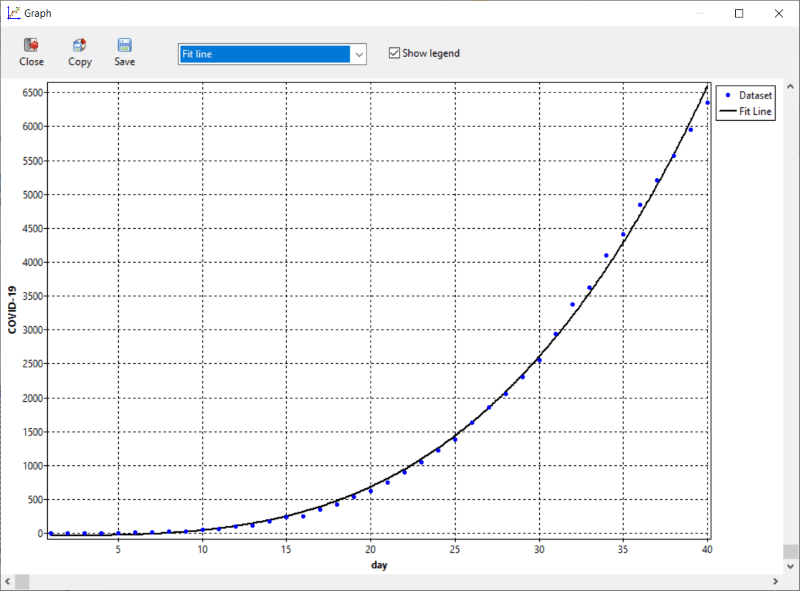
The Fit-line curve is only available when the loaded model has only one independent variable.
Scatterplot:
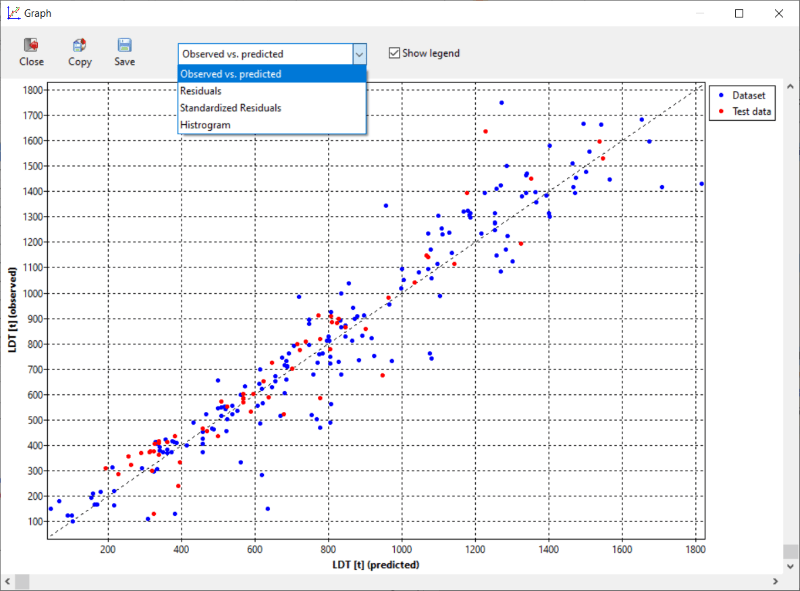
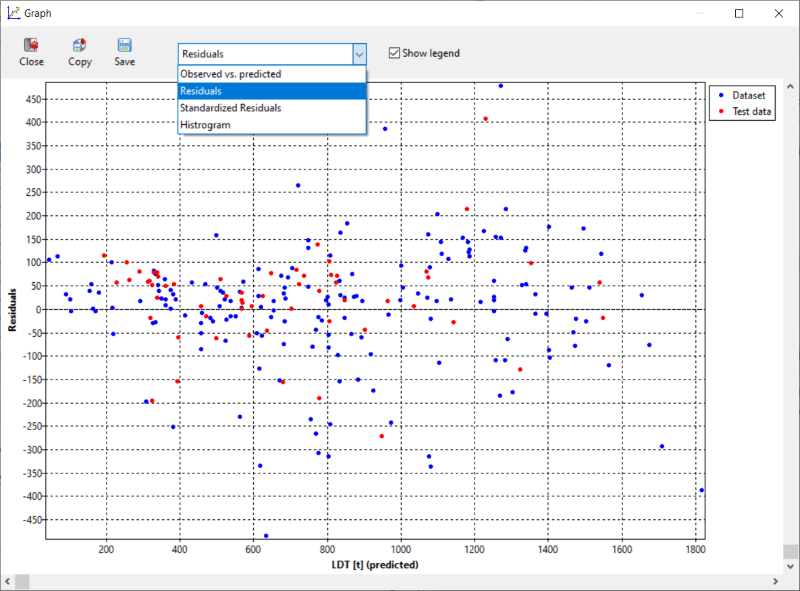
Residuals:
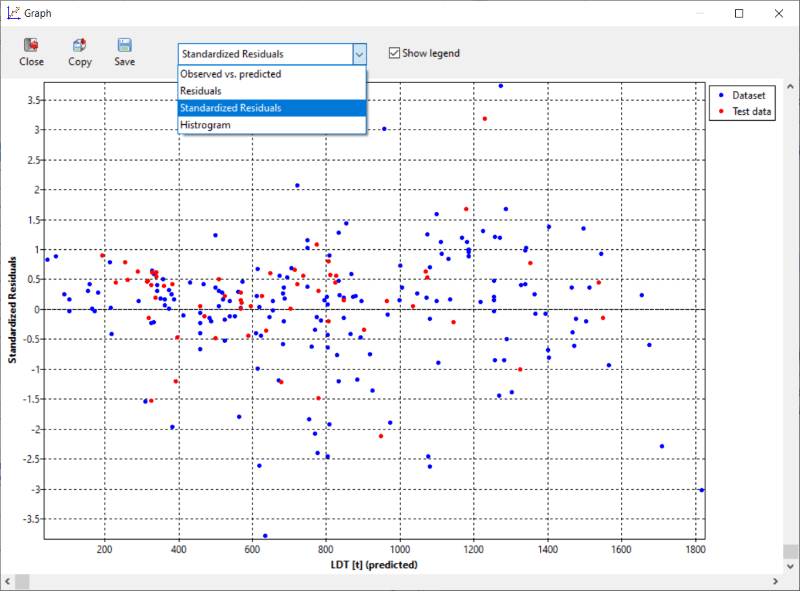
Standardized Residuals:
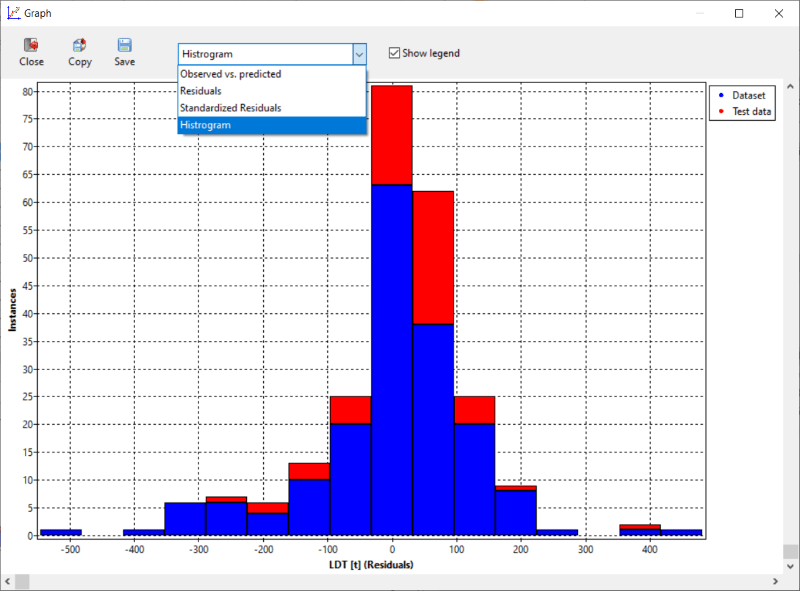
Histogram:
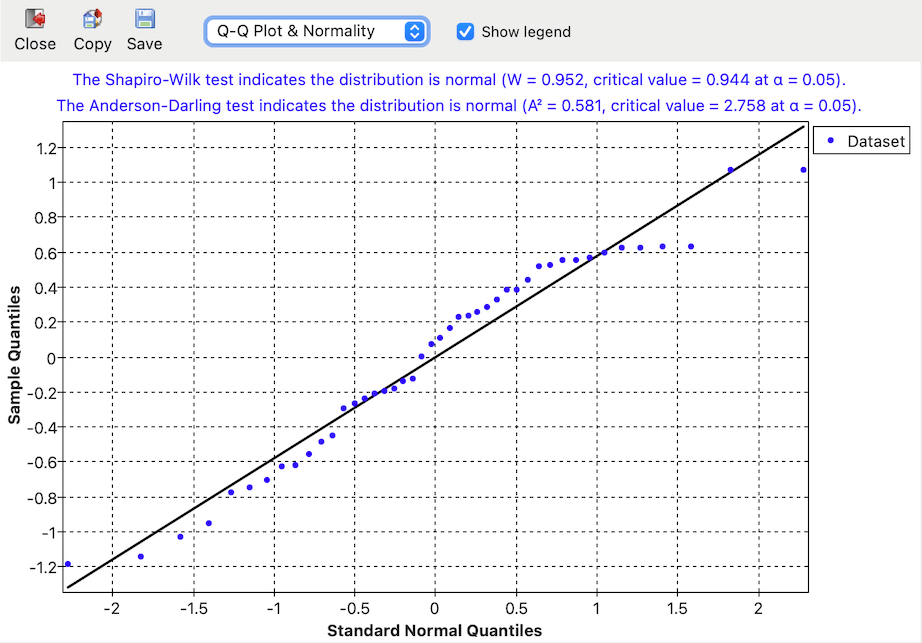
Q-Q Plot and Normality Tests: