What Is Curve Fitting and How Does It Work?
Introduction to Curve Fitting
Curve fitting is a powerful data analysis tool that involves constructing a mathematical model that best represents the relationship between variables in a dataset. It is widely used in various fields such as science, engineering, and business for modeling and prediction purposes. With advanced curve fitting software, like ndCurveMaster, complex regression models can be developed automatically.
How ndCurveMaster Automates Nonlinear Regression
Using the ndCurveMaster tool, we analyzed a dataset and automatically generated a nonlinear regression model of the form:
Y = a0 + a1 * x1^(1/8) + a2 * x2^3.2 + a3 * ln(x3) + a4 * x4^0.55 + a5 * x5^5 + a6 * x6^-1.2
This equation was derived based on advanced nonlinear regression techniques and optimized to minimize errors across the dataset.
Statistical Analysis of the Model
Key Findings
- R Square (R²): The model achieved an R² of 1, indicating an excellent fit to the data.
- RMSE: The root mean squared error (RMSE) was consistent across the dataset (0.0432) and the test set (0.0423), showing robust performance.
- Significance: All parameters were statistically significant (p < 0.05) except for
a4 (x4^0.55), suggesting its limited contribution to the model. - VIF: Variance Inflation Factors were below 5, indicating no multicollinearity issues.
ANOVA Summary
The ANOVA (Analysis of Variance) table provides a detailed breakdown of the regression analysis:
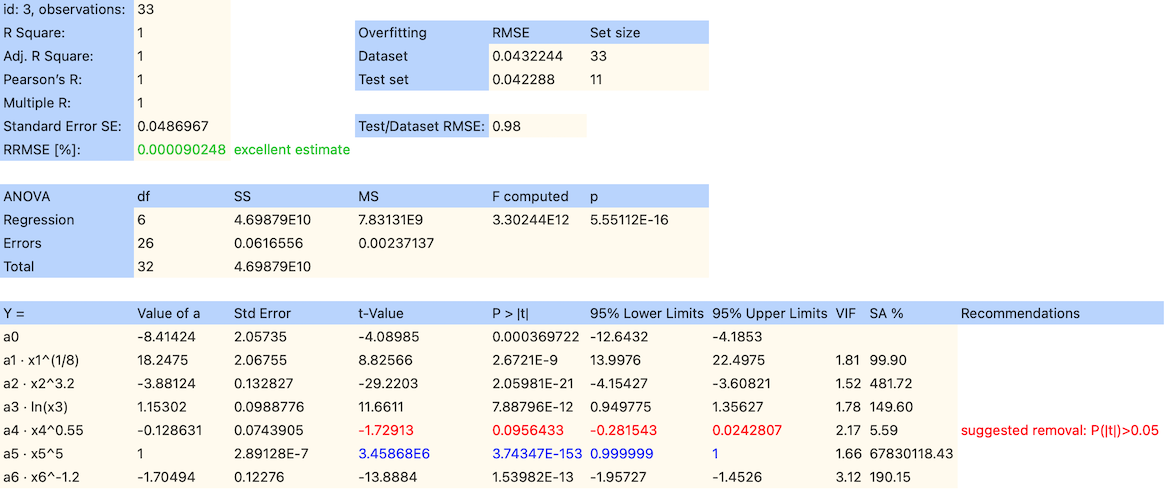
Key Points:
- The regression model explains nearly all variance in the data, as shown by the high sum of squares (SS) for regression (4.69879E10) compared to the residual SS (0.0616556).
- The computed F-statistic (3.30244E12) and its associated p-value (5.55E-16) confirm the overall significance of the model at a very high confidence level.
- The low mean square error (MSE) for residuals (0.00237137) aligns with the low RMSE, indicating excellent predictive accuracy.
Overfitting Analysis
The Test/Dataset RMSE ratio of 0.98 indicates that the model performs consistently on both the training and test datasets, suggesting no significant overfitting. This consistency demonstrates that the model generalizes well to unseen data.
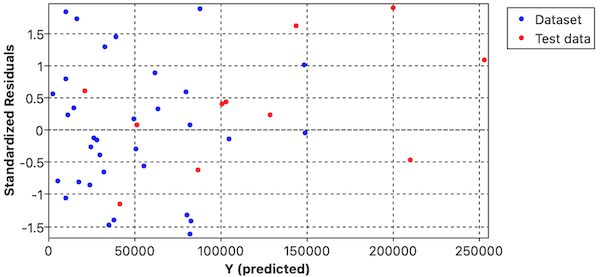
Residual Analysis
The residual plot suggests potential heteroskedasticity, where the variance of residuals changes across predicted values. This is visualized in the plot below:
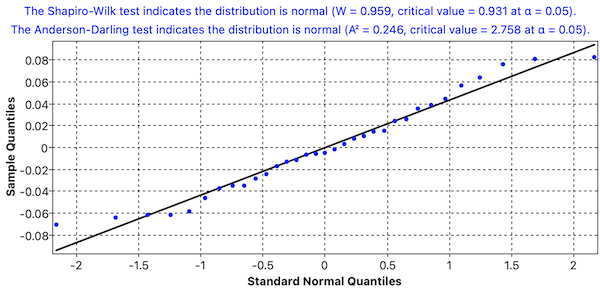
Normality of Residuals
The Shapiro-Wilk and Anderson-Darling tests confirmed the normality of residuals, as shown in the QQ plot:
Variable Significance Analysis
The significance of each variable was evaluated using t-statistics and sensitivity analysis (SA%). The table below summarizes the results:
| Parameter | Value | t-Statistic | p-Value | Significance | SA% |
|---|---|---|---|---|---|
| a0 | -8.414 | -4.09 | < 0.0001 | Significant | - |
| a1 (x1^(1/8)) | 18.247 | 8.83 | < 0.0001 | Significant | 99.90% |
| a2 (x2^3.2) | -3.881 | -29.22 | < 0.0001 | Significant | 481.72% |
| a3 (ln(x3)) | 1.153 | 11.66 | < 0.0001 | Significant | 149.60% |
| a4 (x4^0.55) | -0.129 | -1.73 | 0.0956 | Not Significant | 5.59% |
| a5 (x5^5) | 1.000 | 3.46e6 | < 0.0001 | Significant | 678301.43% |
| a6 (x6^-1.2) | -1.704 | -13.89 | < 0.0001 | Significant | 190.15% |
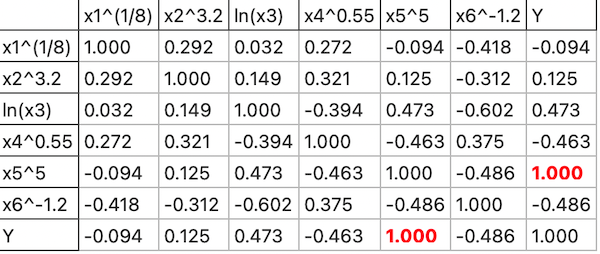
Correlation and Multicollinearity
The Pearson correlation matrix shows relationships between variables, highlighting the strongest predictors:
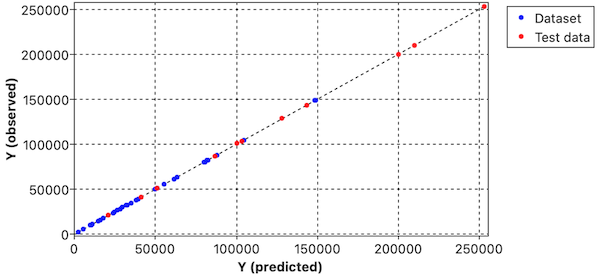
Model Predictions
The relationship between observed and predicted values is visualized below, confirming the model's accuracy:
Conclusion
The ndCurveMaster software effectively performed curve fitting using advanced nonlinear regression techniques, generating a robust model for data analysis.
Model Quality: The model demonstrated an excellent fit, with an R² of 1 and consistent RMSE across both the training and test sets.
Variable Significance: Most variables were highly significant, with x4^0.55 being the only exception, suggesting minimal impact on the model.
Relationships Between Variables: The Pearson correlation matrix highlighted meaningful relationships between predictors, and multicollinearity was not an issue.
Recommendations:
- Investigate heteroskedasticity by applying weighted regression or transformation techniques.
- Consider removing
x4^0.55from the model to simplify it further, as its impact is statistically insignificant. - Explore additional datasets to validate the generalizability of the model further.
This analysis underscores the power of curve fitting tools like ndCurveMaster for deriving accurate and meaningful models in data analysis.