Improving a Regression Model with the Bland–Altman Test
This example shows how to improve a regression model based on medical data in order to remove significant proportional bias. The final model should also remain reliable for test data originating from a second, independent medical study. In both cases, a positive Bland–Altman test result is required.
This tutorial presents a practical data-driven workflow in ndCurveMaster for regression model improvement, proportional bias reduction, and validation on an external test set.
For the test set, it was assumed that the model would be satisfactory if the error in the test set was not more than 50% higher than the error in the main dataset.
The data were saved in the file BlandAltman.txt. You can download this file here.
The first 90 rows refer to the main dataset, that is, the primary study on the basis of which the regression equation will be determined. Records from 91 to 171 represent test data originating from a second medical study.
This means that the test set constitutes 47.37% of the entire dataset.
When loading the data, the overfitting control option should be enabled, the test set percentage should be set to 47.37%, and random test set selection should be disabled. As a result, the last 47.37% of the data will be assigned to the test set.
In this analysis, nonlinear relationships will be searched for using the function set Polynomial, rational and power functions up to 3.
Therefore, we load the file BlandAltman.txt and enter the settings shown in the figure below:

As can be seen, the output variable is y, and the input variables are x1, x2, x3. In addition to the previously described settings related to the dataset and the function set, the Multicollinearity detection option was also enabled in order to check multicollinearity among the variables.
It is also important that, after selecting the Use a test set to detect overfitting option, the Random selection of a data sample option is unchecked. As a result, the last cases, that is, records from 91 to 171, will be selected as the test set.
After loading the data, it is necessary to verify whether the cases were correctly assigned to the training set and the test set. To do this, click View | Data and check the last column. After scrolling to about the middle of the table, it can be seen that the program grouped the data correctly:
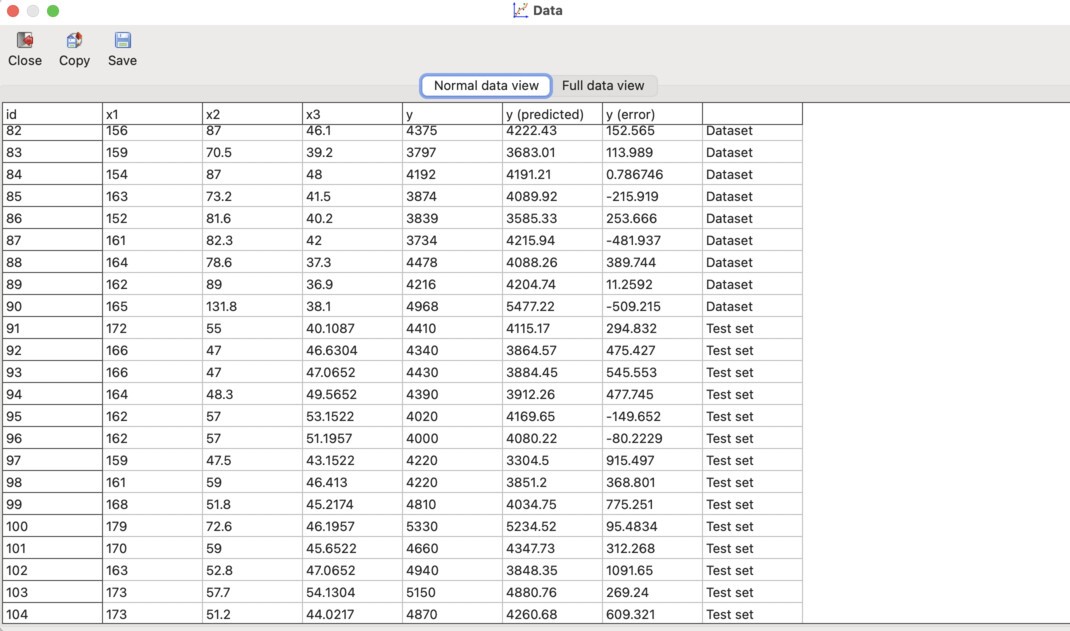
In this screenshot, it can be seen that the last case belonging to the main dataset (Dataset) has id = 90, while the cases from id = 91 to the end were assigned to the Test set.
The statistics in the Statistics window indicate that the variables are not collinear, because the VIF values are low:

This is also confirmed by the Pearson correlation matrix:
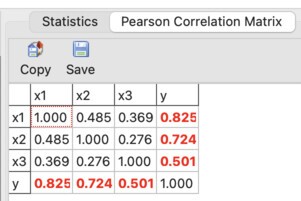
This means that multicollinearity control can be disabled during model searching, which speeds up the program.
However, if we look at the Bland–Altman test for the linear model:
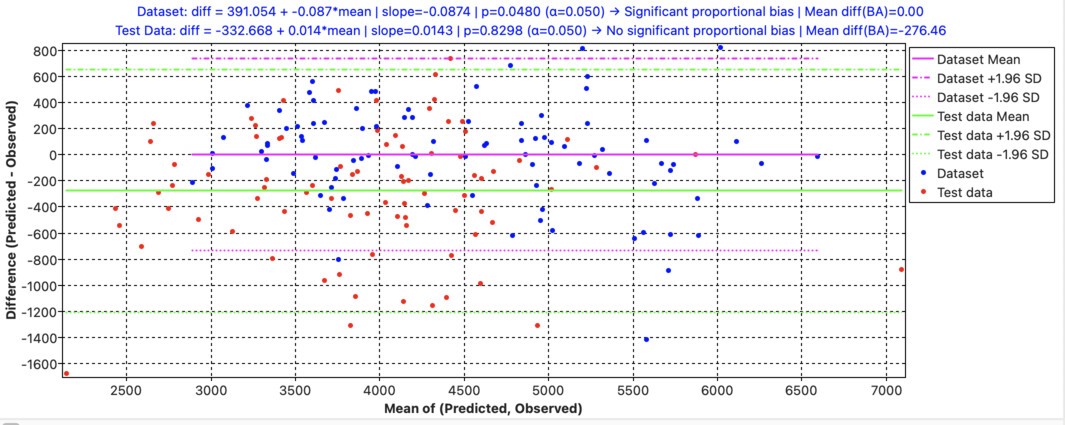
It can be seen that a significant proportional bias is present in the dataset, because p < 0.05.
Therefore, we will try to fit appropriate power functions to the predictors x1–x3 in order to remove this proportional bias, that is, to obtain p > 0.05.
Enter the settings shown in the figure below:
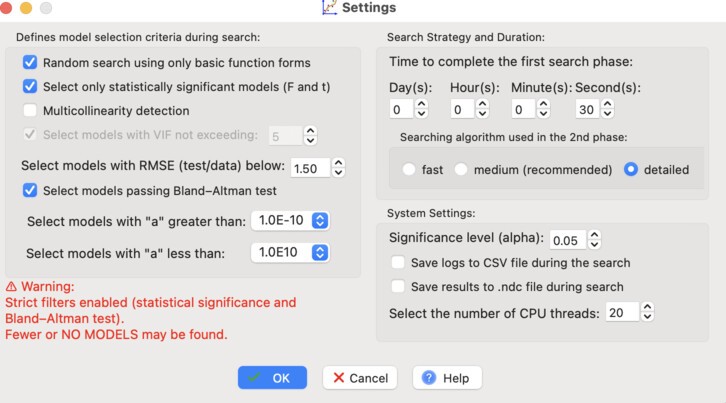
Selecting the Random Search using only basic functions option means that only basic functions will be used in the random search phase. This makes it possible to find the most general models at the beginning of the analysis.
The Select only statistical models option limits the results to statistically significant models in which all predictors are statistically significant.
The Multicollinearity detection option is unchecked because there is no need to verify multicollinearity again. This has already been confirmed earlier.
We also select the Select models using Bland-Altman test option. This is the most important setting, because we want to find models without significant proportional bias.
We extend the duration of the first phase, that is, the random search phase, to 30 seconds.
In the second phase, we choose the detailed (detailed) search algorithm, which works iteratively.
In the field Select the number of CPU threads, set the maximum possible value — this will speed up the equation search.
Then click the Advanced Search button.
In the bottom right corner of the program, on the status bar, it can be seen that 3 basic functions were discovered during the search.

After a while, a screen appears showing several discovered equations:

The most accurate nonlinear equation, labeled id: 6, has the following form:
y = a0 + a1 · x12.35 + a2 · x20.4 + a3 · x33
This equation is slightly more accurate than the initial linear model:
RMSE(id: 6) = 367.4 < RMSE(id: 1) = 372.7
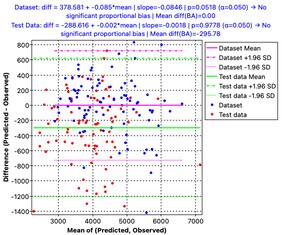
Most importantly, the probability of the absence of significant proportional bias exceeded the required threshold: p = 0.0518 > 0.05.
The figure below compares the details of the Bland–Altman test for both models:
| Linear equation id: 1 | Nonlinear equation id: 6 |
|---|---|

|
|
Download the completed analysis
Finally, you can download the ndCurveMaster file containing the completed analysis here: BlandAltman.ndc.
Frequently Asked Questions
What is the purpose of this regression model tutorial?
This tutorial shows how to improve a regression model using the Bland–Altman test, reduce proportional bias, and validate the model on an independent medical test set.
Why is the Bland–Altman test important here?
The Bland–Altman test is used here to check whether the model shows significant proportional bias. The goal is to obtain a model for which p > 0.05.
Why was the test set selected from the last part of the dataset?
The last observations come from a second independent medical study, so disabling random sampling ensures that these cases remain in the test set for external validation.
Why was multicollinearity detection turned off during the search?
Because the VIF values and Pearson correlation matrix already showed that the predictors were not strongly collinear, disabling this option speeds up the search without affecting the conclusions.